Can Indicators Really Predict Market Moves? Let’s Take a Look
In trading, timing is everything. Getting in just a little early—or late—can make the difference between profit and pain. That’s why traders keep searching for tools that can forecast what might come next. And while there are no crystal balls, some tools come pretty close. These tools are known as common trading indicators. Built into nearly every trading platform, they attempt to read momentum, trend shifts, and volatility patterns. Below are seven indicators that traders rely on not just to interpret the market—but to try and stay ahead of it.
1. RSI – Can It Predict When a Trend Will Reverse?
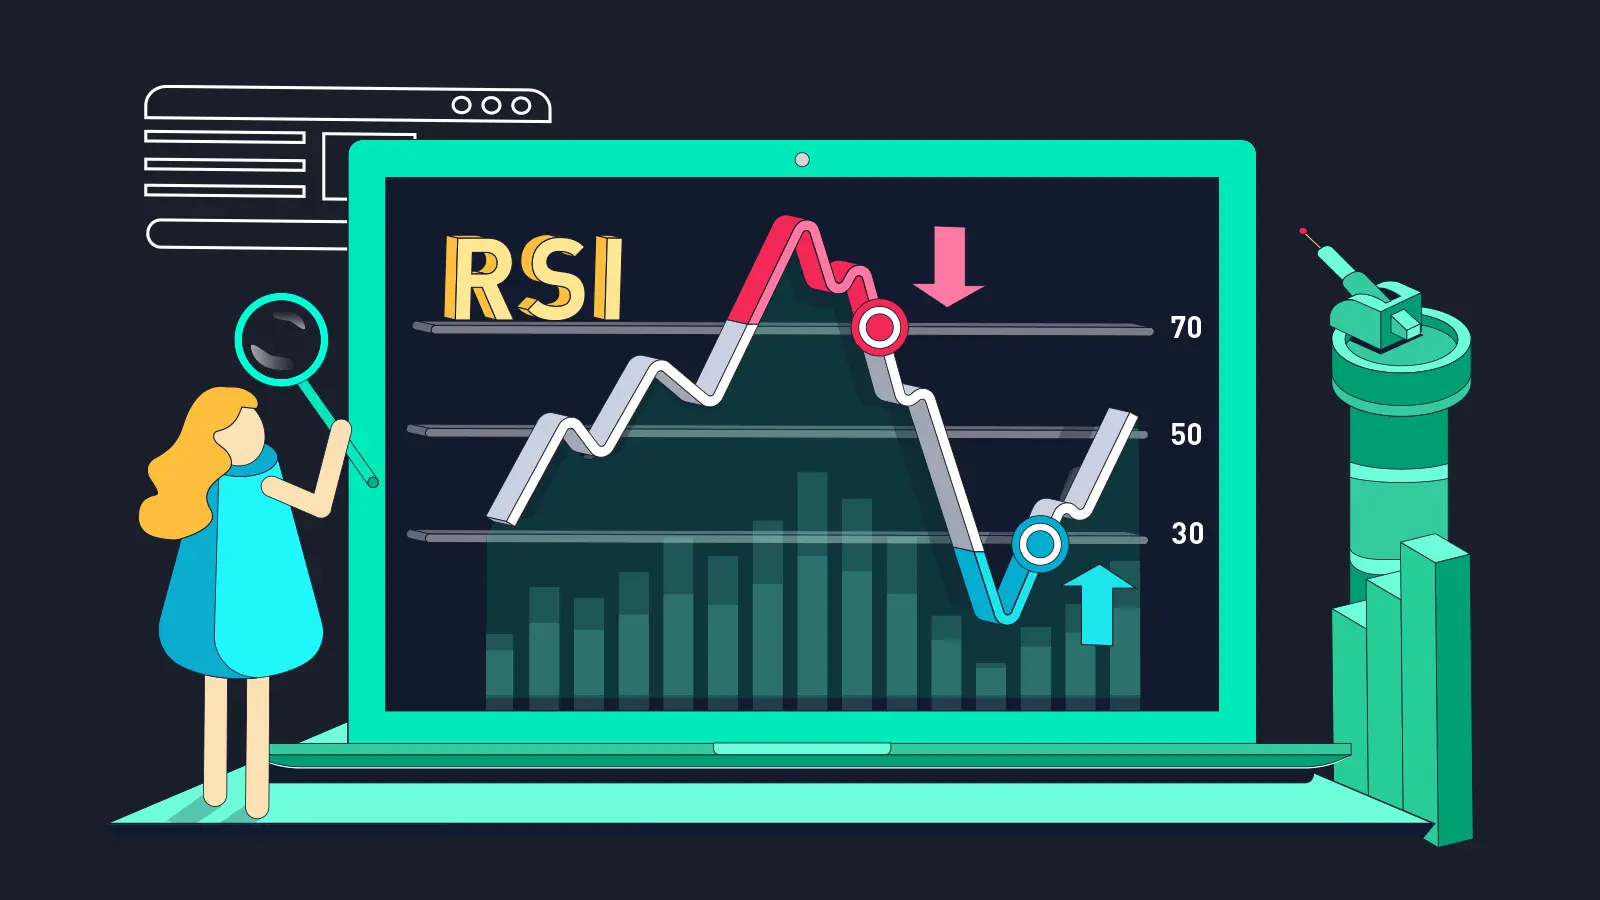
The Relative Strength Index (RSI) is widely used to detect potential turning points. It tracks momentum and flags when a market might be overbought or oversold.
Forecasting Potential:
When RSI dips below 30 and rises again, traders often expect a bounce. Above 70? They brace for a pullback. But beware—during strong trends, RSI can stay extreme for longer than expected. Still, it remains a go-to signal for anticipating exhaustion.
2. Moving Averages – The Backbone of Common Trading Indicators for Trend Forecasting
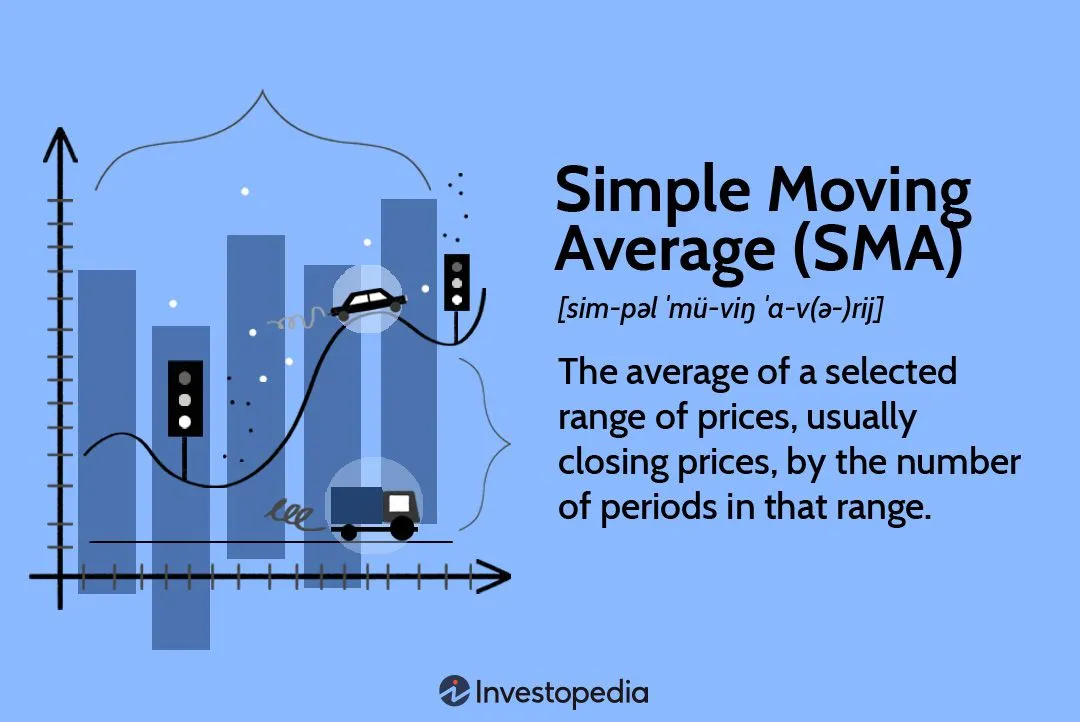
Moving averages (especially EMA and SMA) help traders identify whether prices are trending up, down, or sideways. Crossovers—like the golden cross or death cross—are among the most watched forecasting tools in trading.
Forecasting Potential:
A short-term average crossing above a long-term one might signal a trend shift. But moving averages are lagging tools—they don’t predict the move; they confirm it. Use them with caution when trying to get ahead of price.
3. MACD – A Momentum Signal That Traders Watch Closely
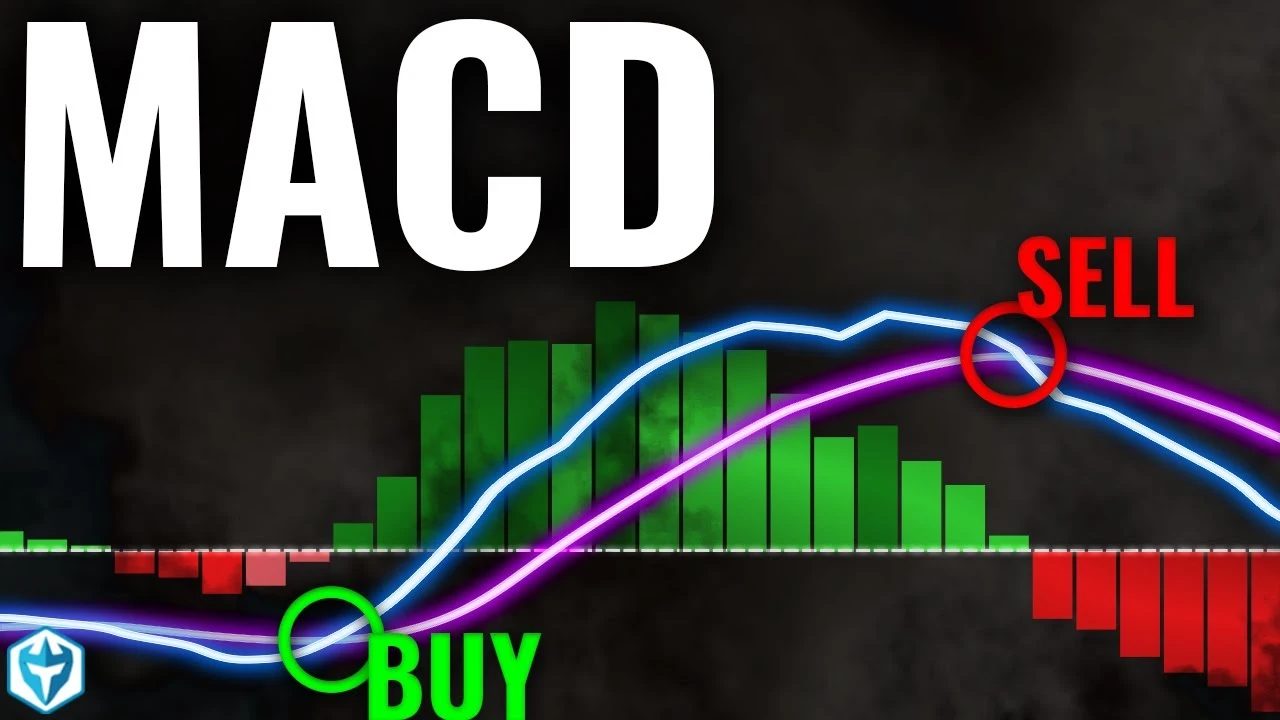
The MACD (Moving Average Convergence Divergence) tracks the difference between two moving averages. When its lines cross or its histogram changes direction, traders often interpret it as a shift in momentum.
Forecasting Potential:
MACD can be a reliable early signal—especially when confirmed by other tools. A MACD line crossing above the signal line may hint at building bullish momentum.
4. Bollinger Bands – Forecasting Volatility Before It Strikes
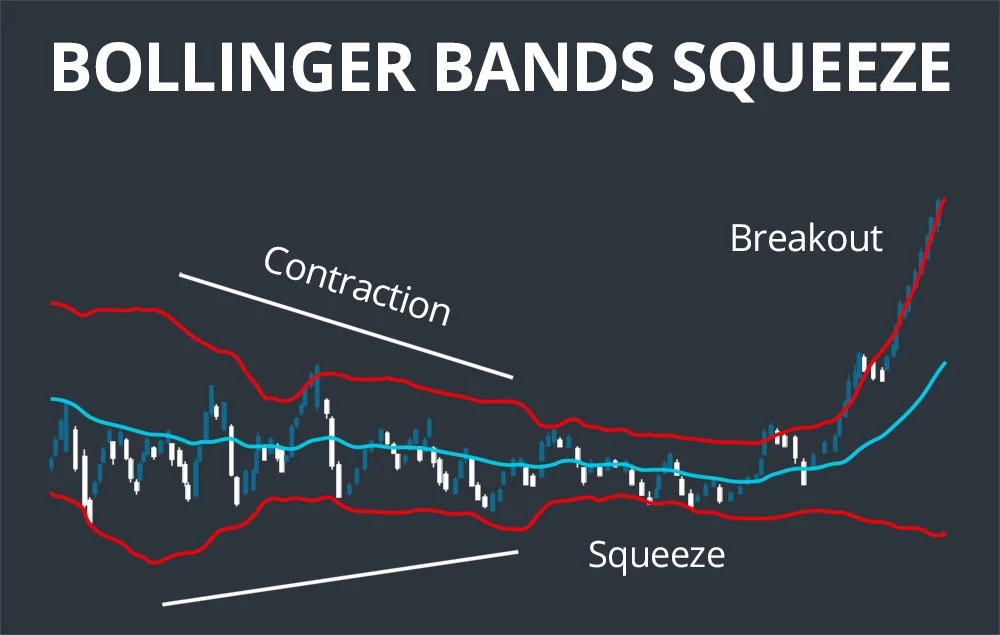
Bollinger Bands expand and contract with market volatility. When the bands squeeze, it’s a sign the market is quiet—too quiet. Often, a squeeze is followed by a sharp breakout.
Forecasting Potential:
Tight bands are like coiled springs. They don’t tell you the direction—but they often predict something big is coming. Watch price action and volume to guess the direction.
5. Stochastic Oscillator – Another Forecasting Tool for Overbought/Oversold Conditions
The Stochastic Oscillator compares the closing price to a range of past prices. It’s used to find potential reversal points before they happen.
Forecasting Potential:
When the %K line crosses above the %D line in oversold territory, it might predict a bounce. It’s often used as a warning sign—especially when supported by RSI.
6. Volume – The Confirming Factor in Common Trading Indicators

Volume isn’t always considered a classic “indicator,” but it plays a massive role in forecasting. Spikes in volume often come before major price movements.
Forecasting Potential:
Watch for increasing volume during breakouts—it often confirms the move is real. No volume? The move might be short-lived.
7. Fibonacci Retracement – Predicting Possible Bounce Points
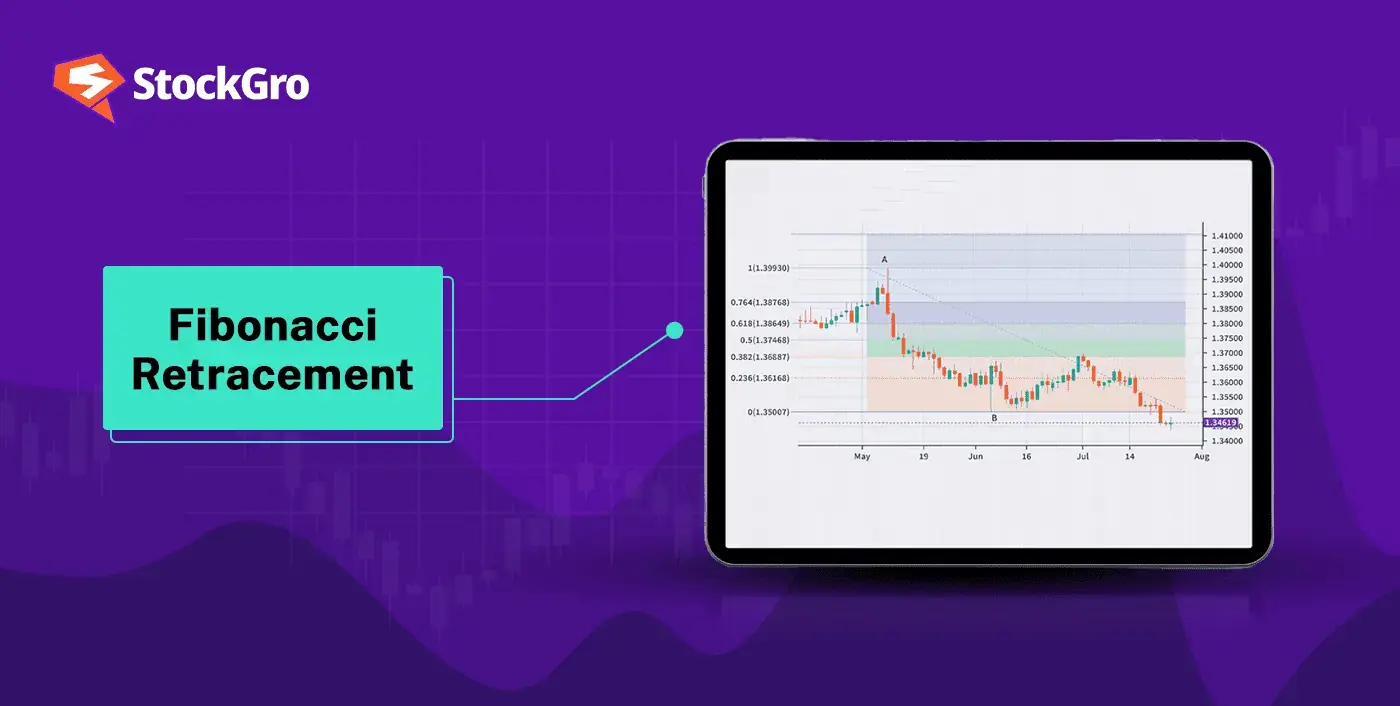
Fibonacci retracement levels (like 38.2%, 50%, and 61.8%) are widely used to forecast potential support and resistance areas.
Forecasting Potential:
When a price pulls back to a Fib level and stalls, it may bounce. Many traders set alerts around the 61.8% zone, expecting a reaction. It’s not foolproof—but it often aligns with market psychology.
So, Can Common Trading Indicators Really Help You Predict the Market?

Short answer: sometimes. No indicator can predict the future with perfect accuracy—but common trading indicators give you clues. Patterns. Hints. When used together, they can help you anticipate where the market might go next—and prepare for it.
The smartest traders aren’t looking for perfect predictions. They’re looking for probability edges. And that’s what these tools provide.
So test them. Combine them. Learn how they behave in real conditions. With experience, you’ll learn that it’s not about seeing the future—it’s about reading the signs just a little earlier than everyone else.
Relevent news: Here

